
RAWGraphs Webinars on Data Visualization
2023-09-22
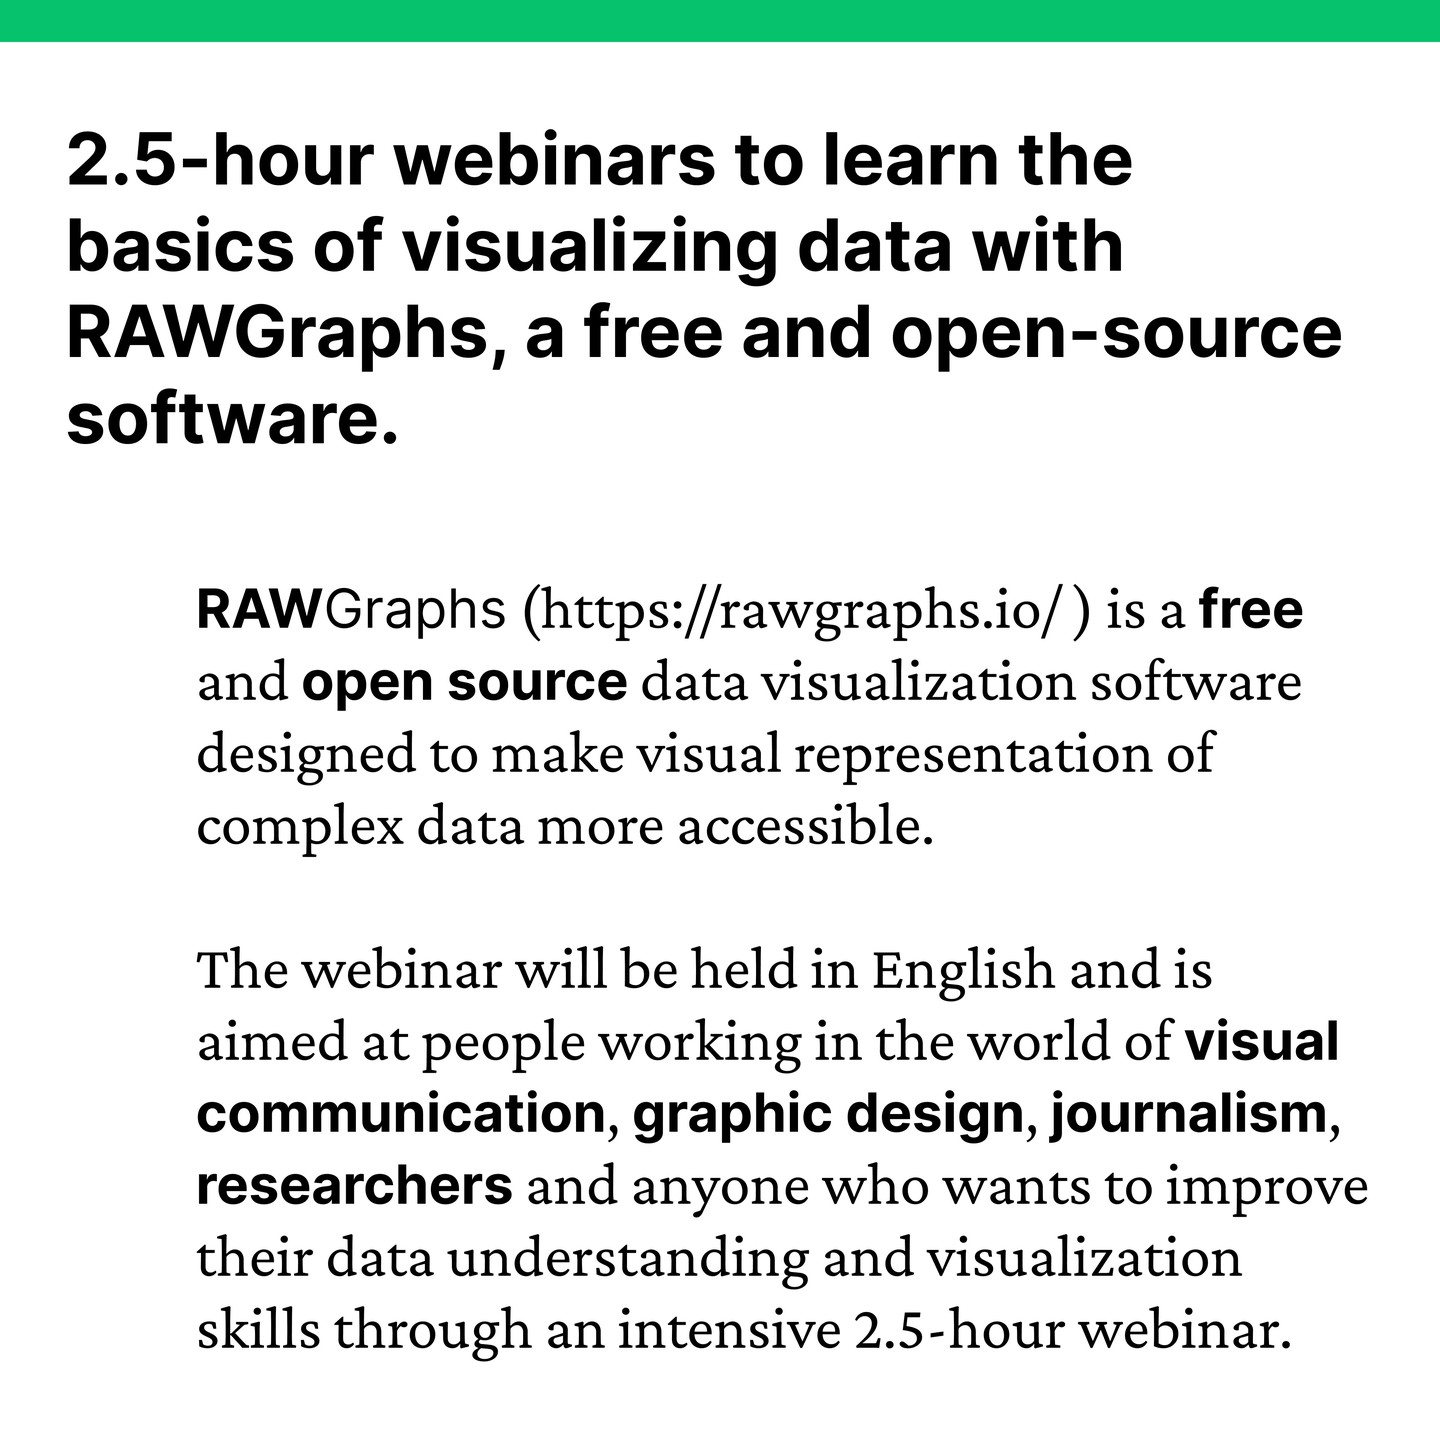
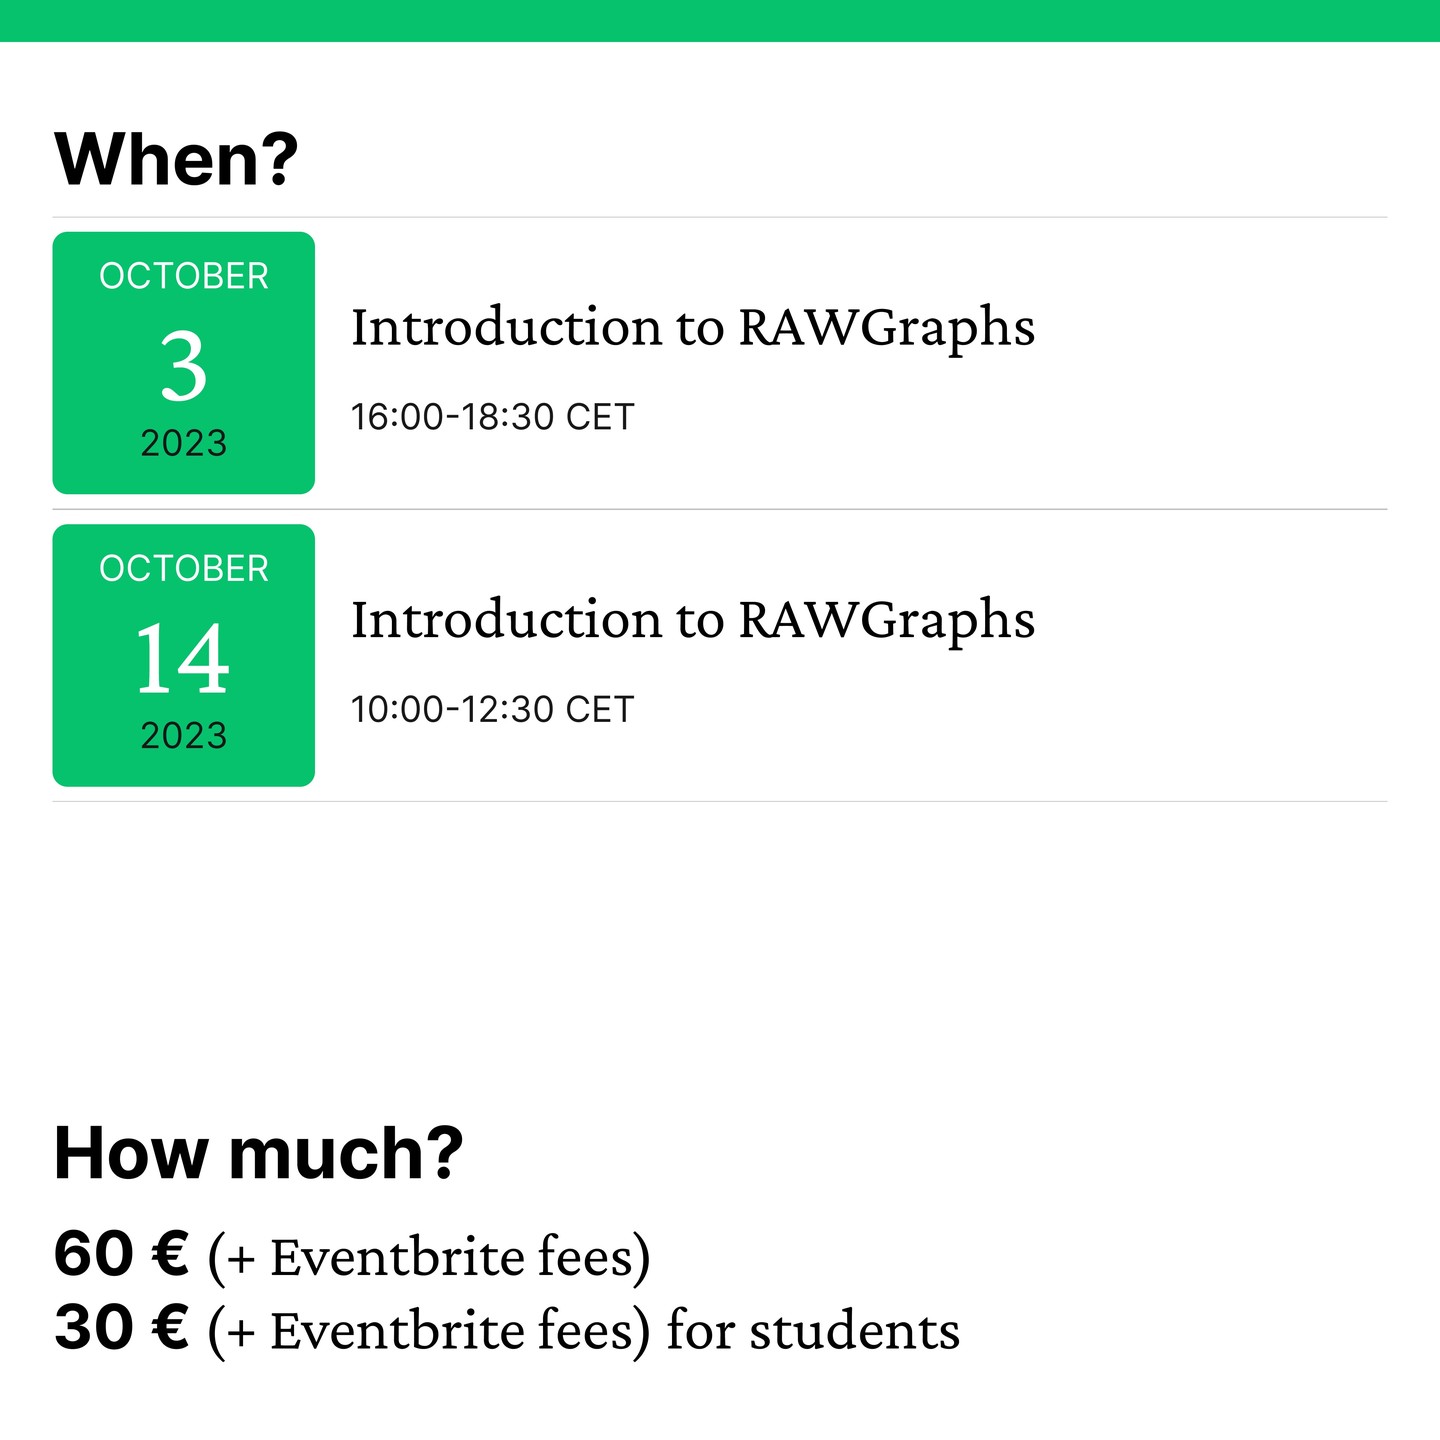
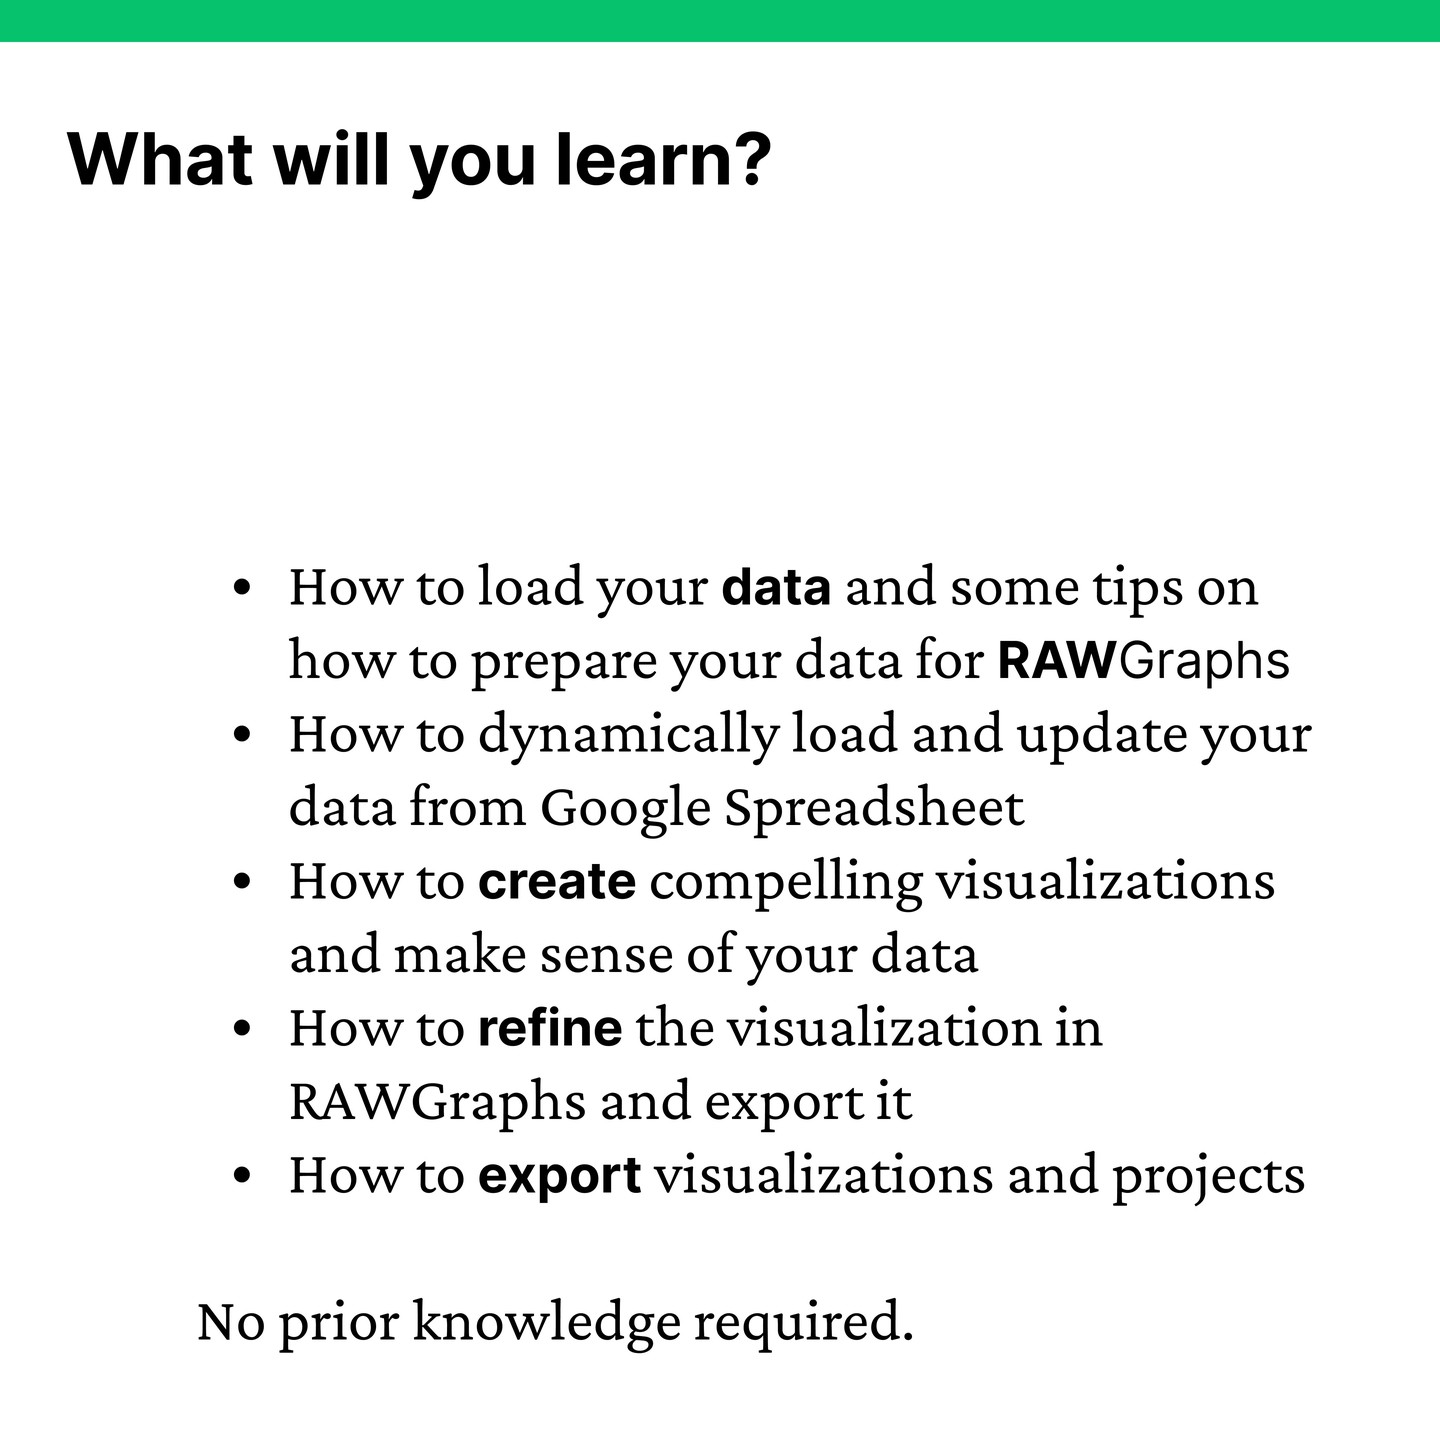
We are organinzing a series of webinars to teach people how to use the tool and learn the basics of data visualization. Held in English, they were aimed at anyone working in visual communication, graphic design, or journalism, as well as researchers and anyone looking to sharpen their data understanding and visualization skills through an intensive 2.5-hour session. Proceeds from ticket sales go directly toward supporting a free and open-source project: the more financial support RAWGraphs receives from sponsors and users, the more time we can dedicate to it. Find all the information at https://www.rawgraphs.io/courses