RAWGraphs
A free and open source tool for data visualization
Clients
Year
2013 - ongoing
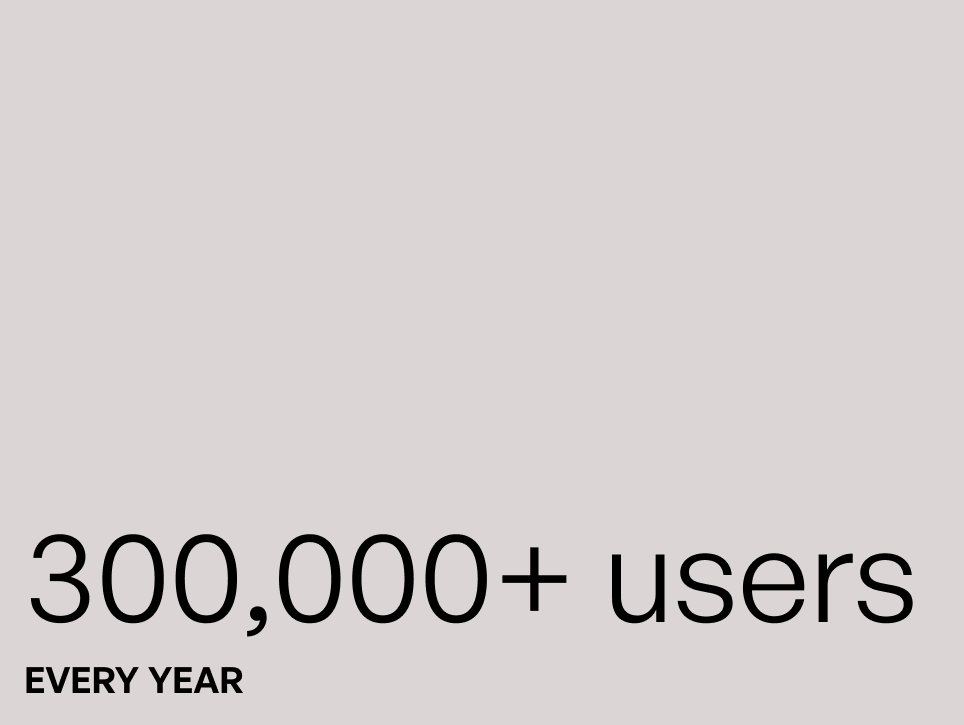

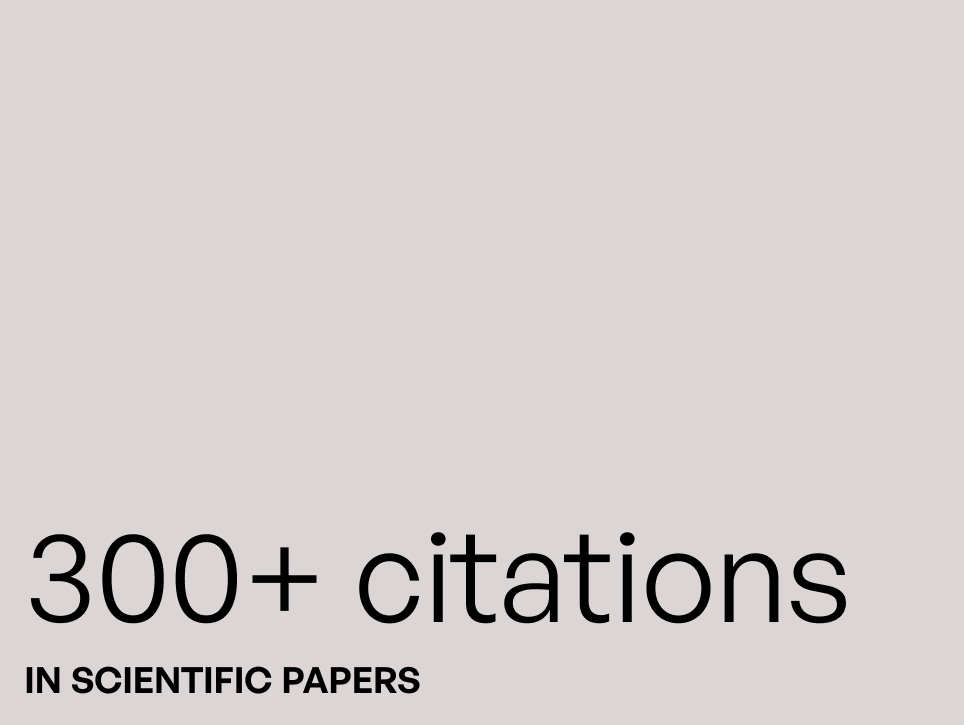
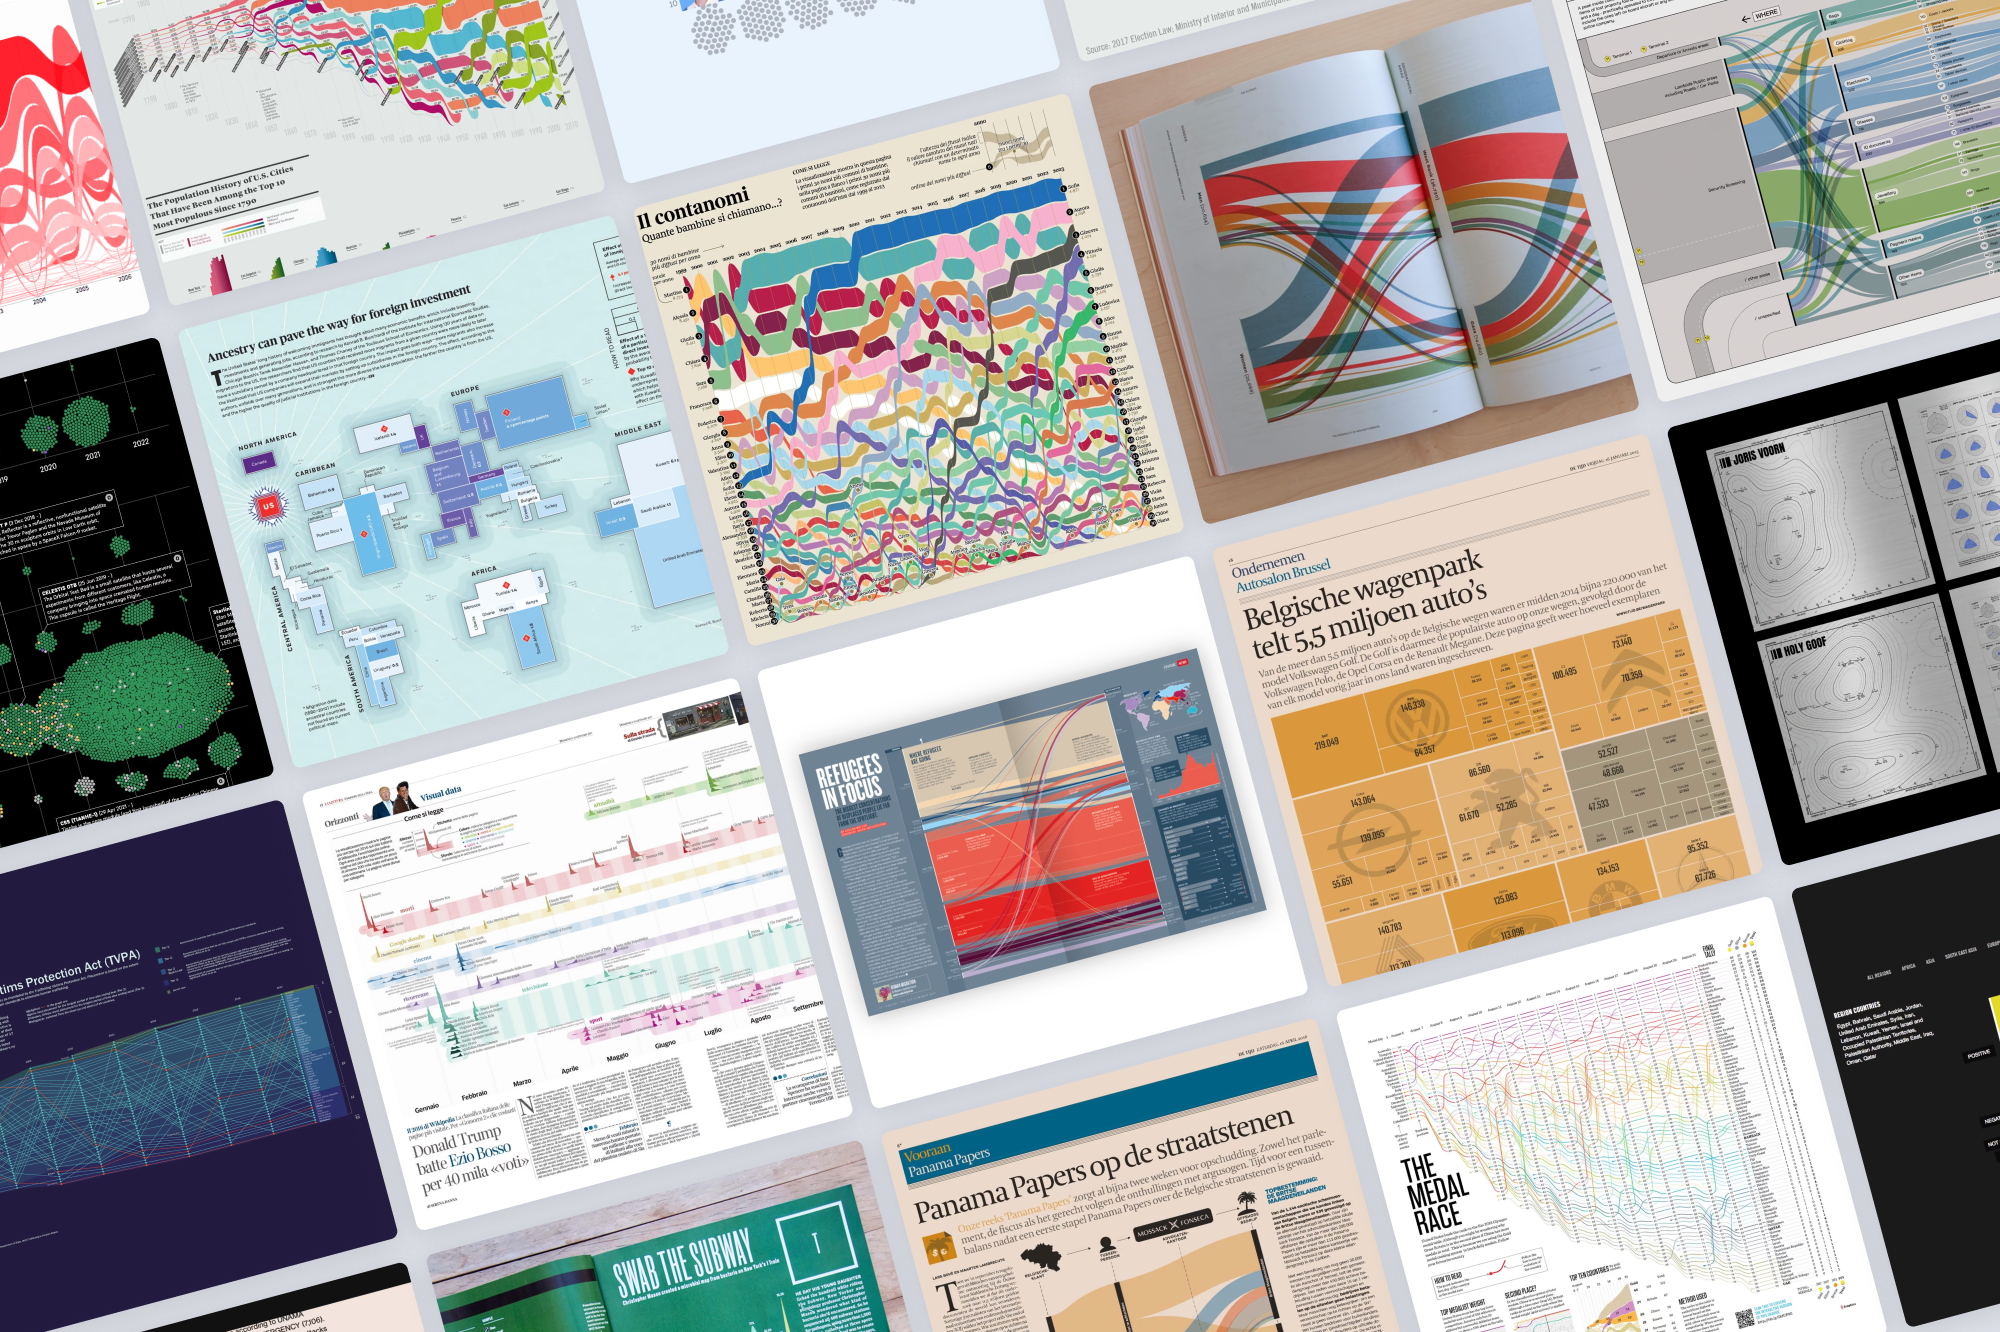
RAWGraphs is an open-source data visualization tool designed to make the visual representation of complex data accessible without requiring programming skills. It allows users to transform tabular data into a variety of visual formats and export them for further refinement.
Positioned between spreadsheet tools and graphic design software, it supports exploratory data analysis as well as the production of publication-ready visualizations. The tool is used by thousands of users every month across research, journalism, and design contexts.
Other projects
Year
Project
Clients
Services
2021
Chemical Youth website
A website to explore a research project about the use of chemicals in everyday life of youth
University of Amsterdam
AnthropologySocial studiesHealthResearch
2021
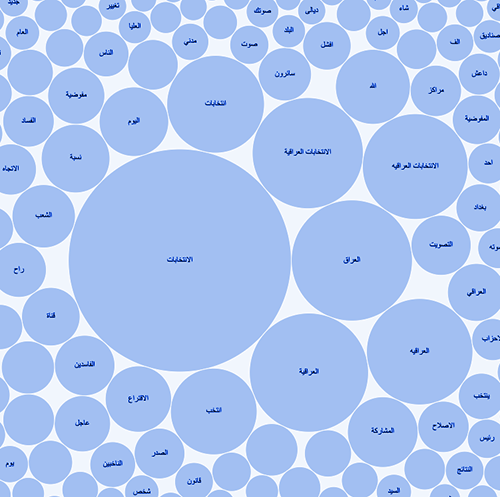
Monitoring hate speech online
A visual tool to explore social media data and identify hate speech in the twittersphere
UNDP
Digital CultureDigital ProductsSocial Studies
2018
Mapping the Internet Health Movement
A research project to map the Mozilla Galaxy
Mozilla Foundation
Digital CultureResearch

2016
Chemical Knowledge Research
Establishing and stabilizing knowledge of psychedelics and designer drugs on Wikipedia
University of Amsterdam
Digital MethodsSocial StudiesHealthResearch