Reveal (December 19–20)
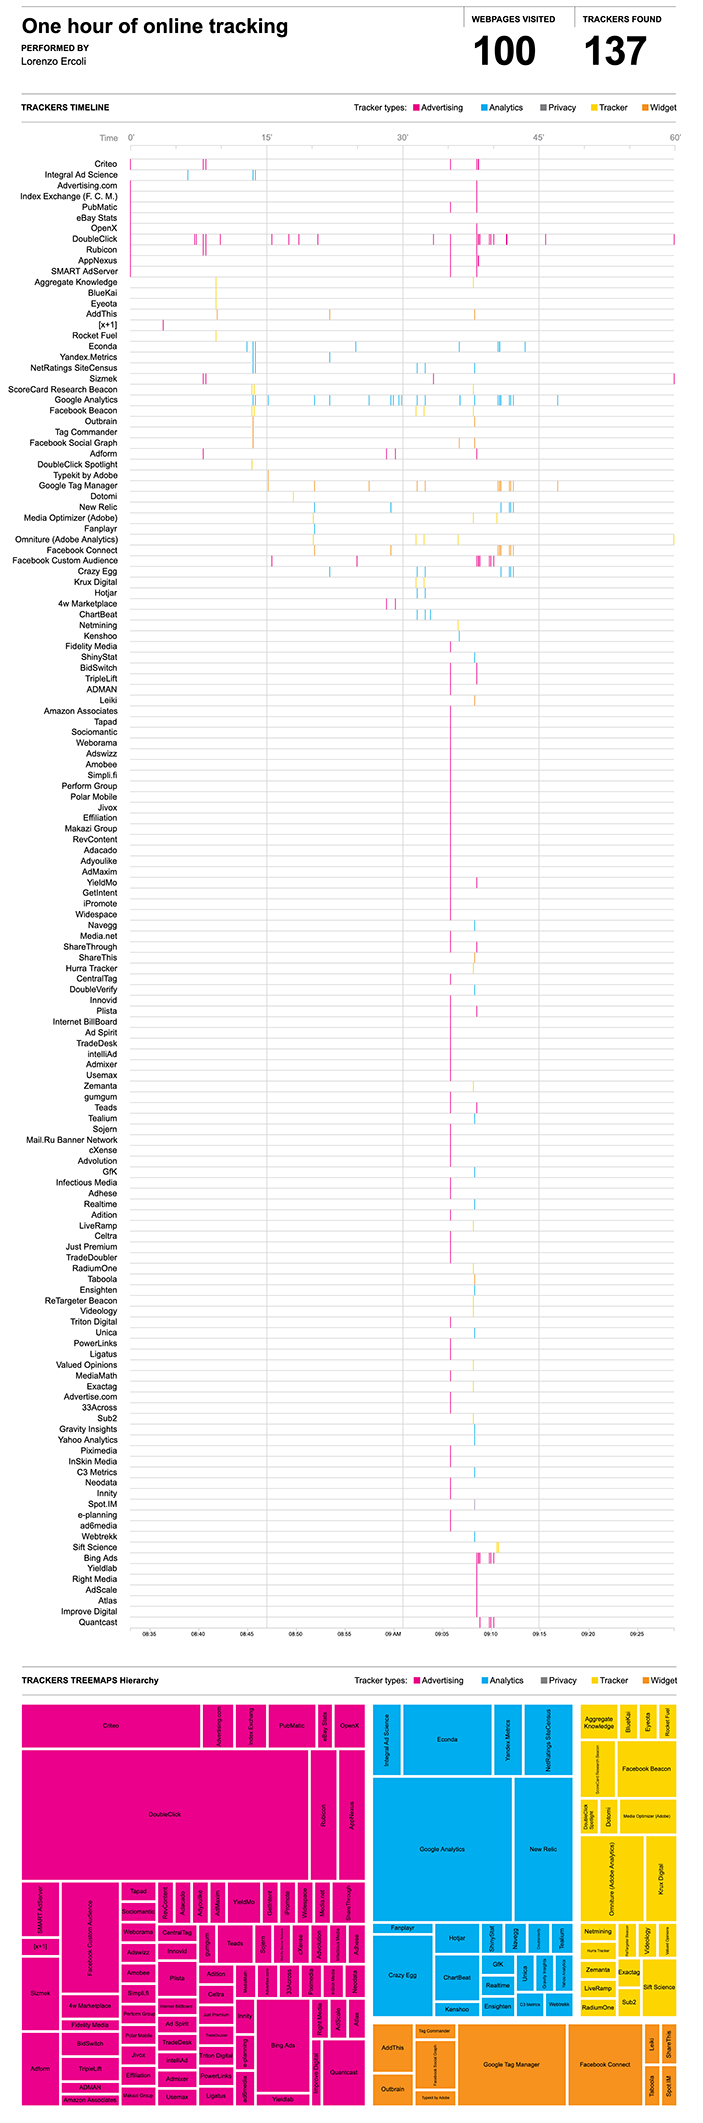
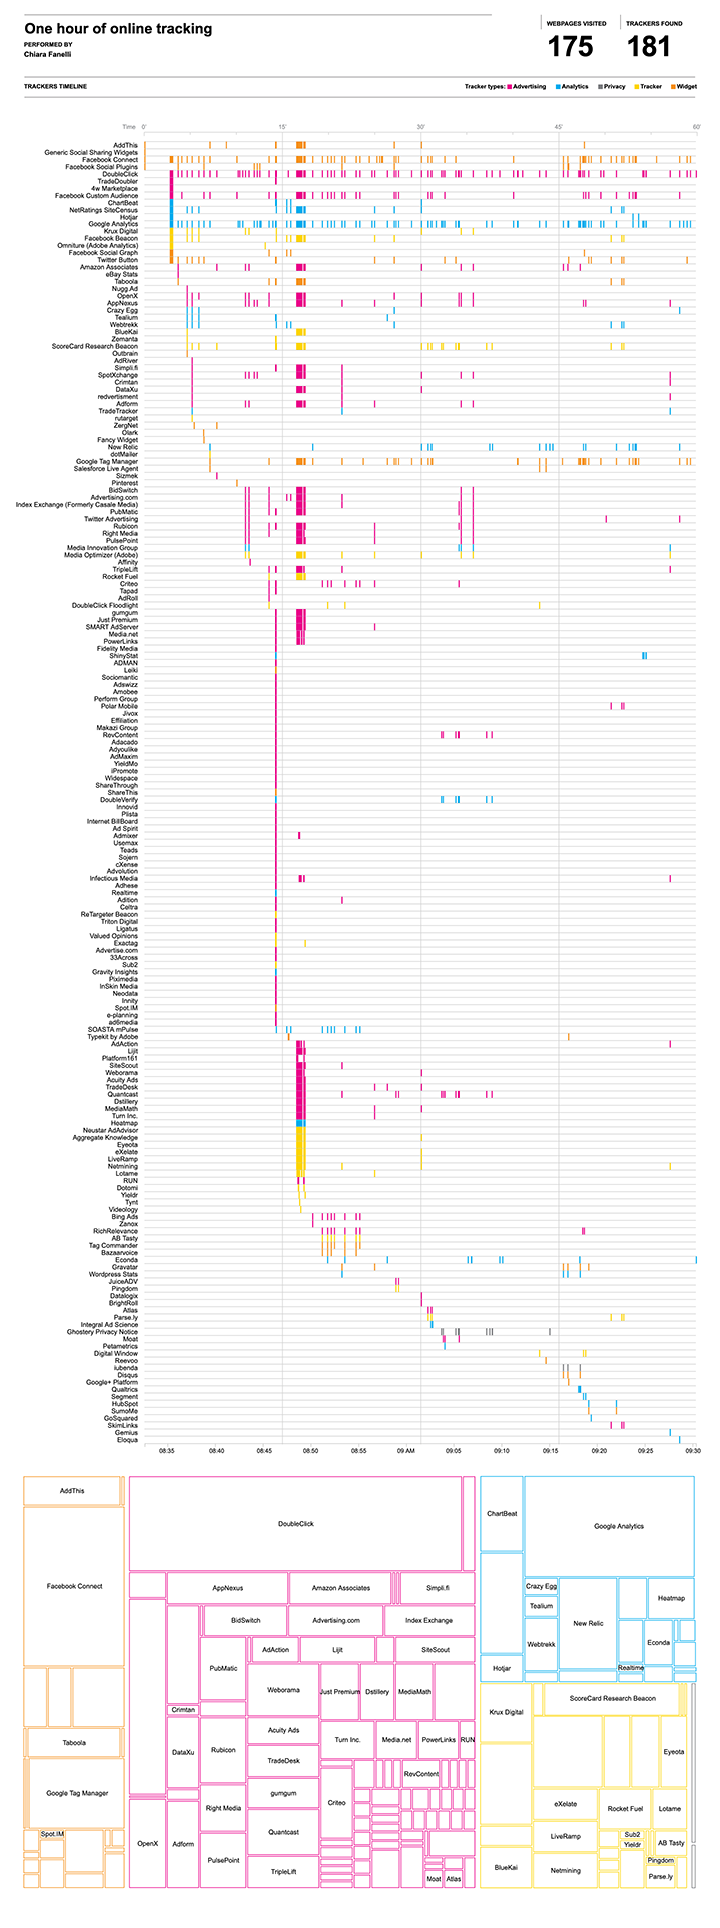
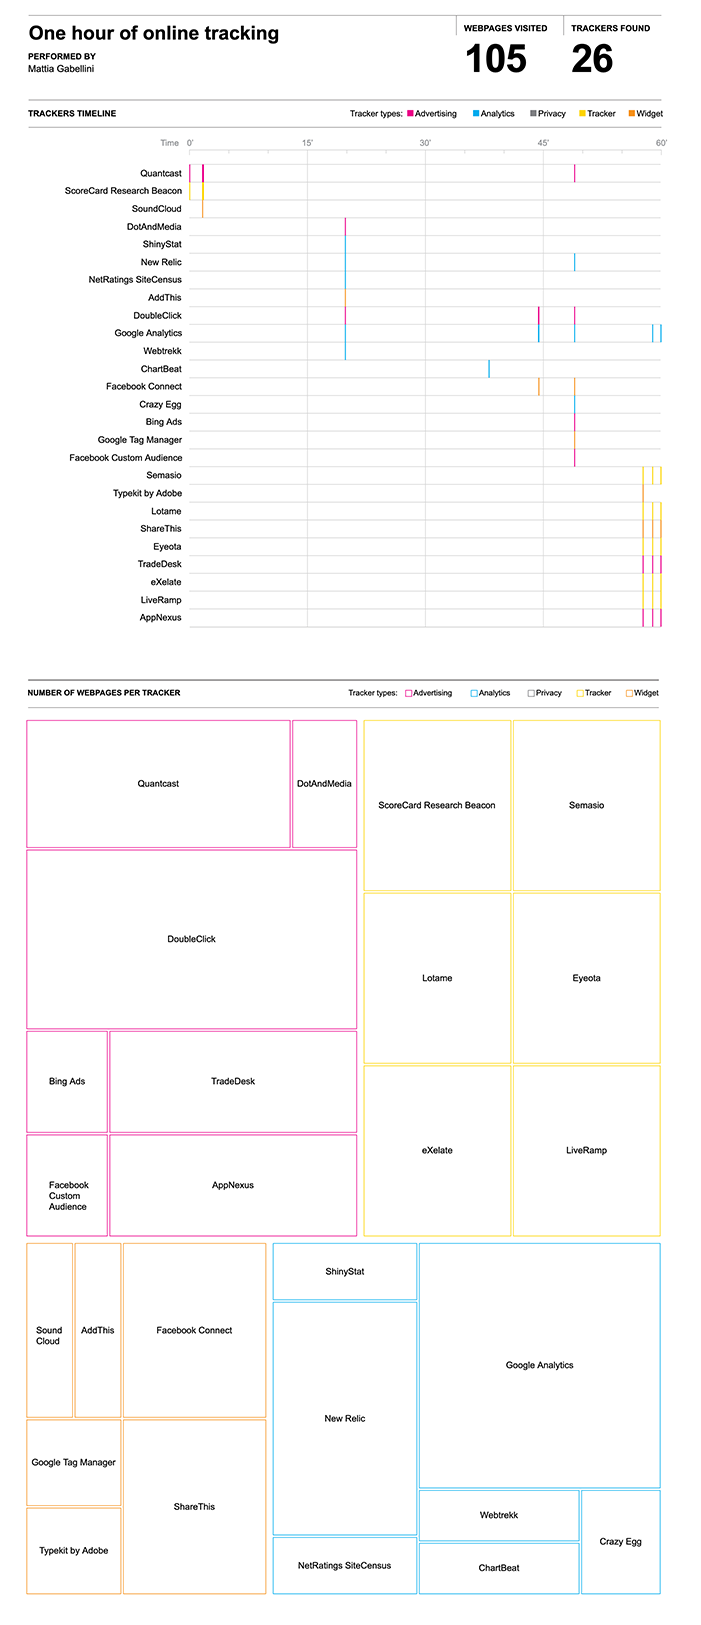
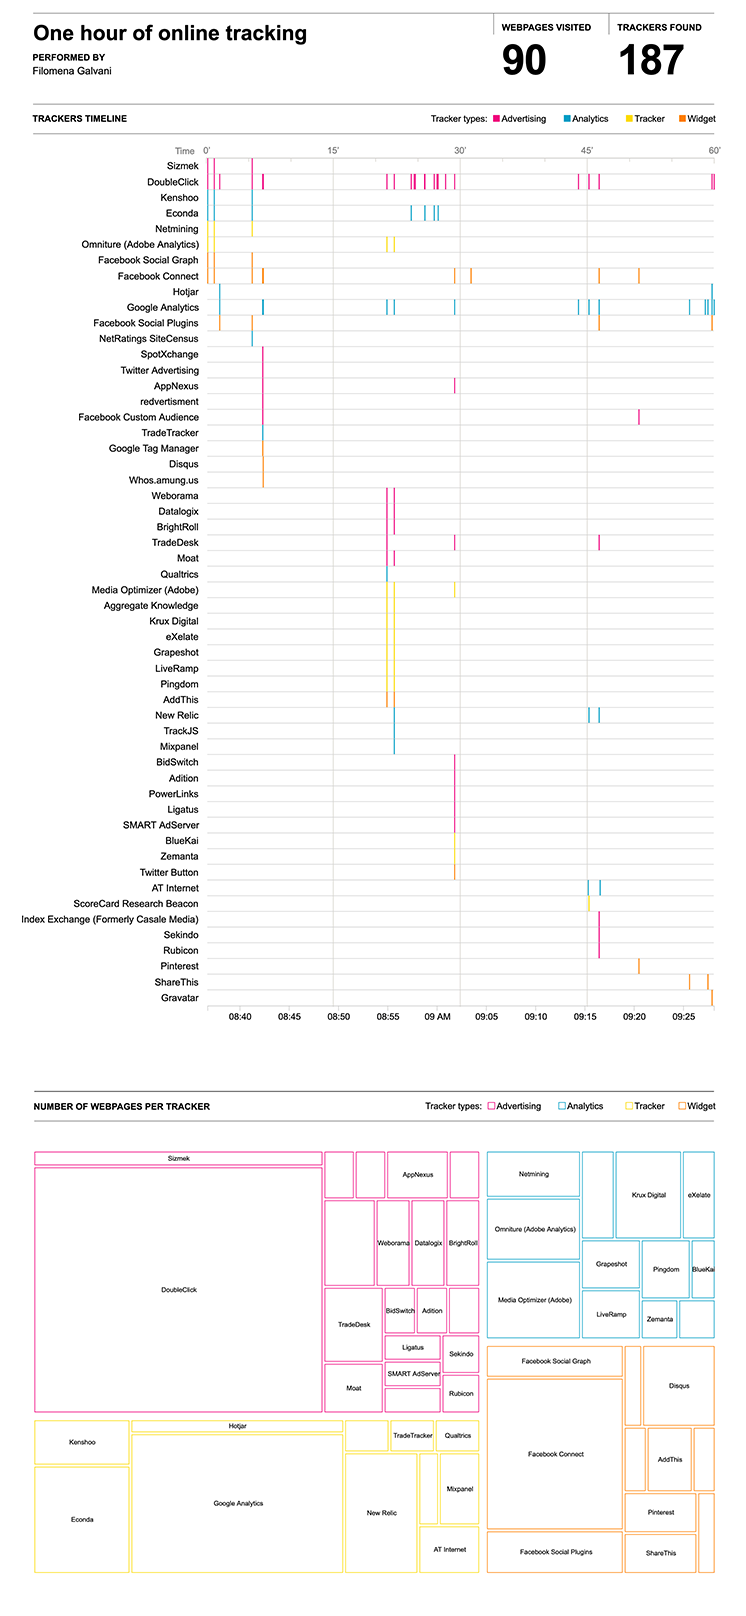
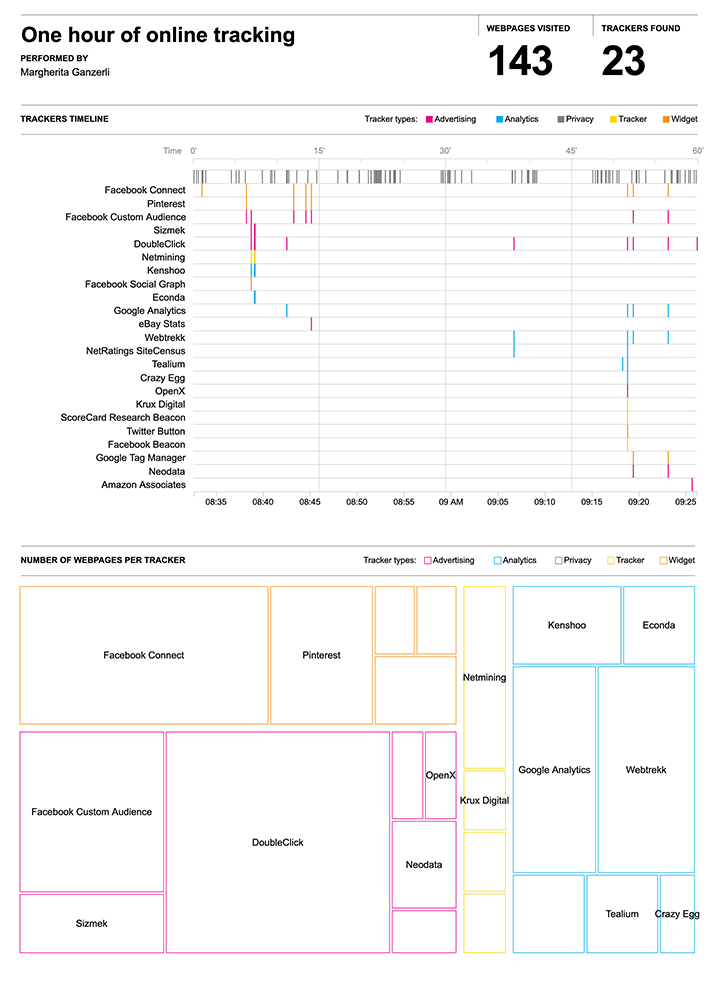
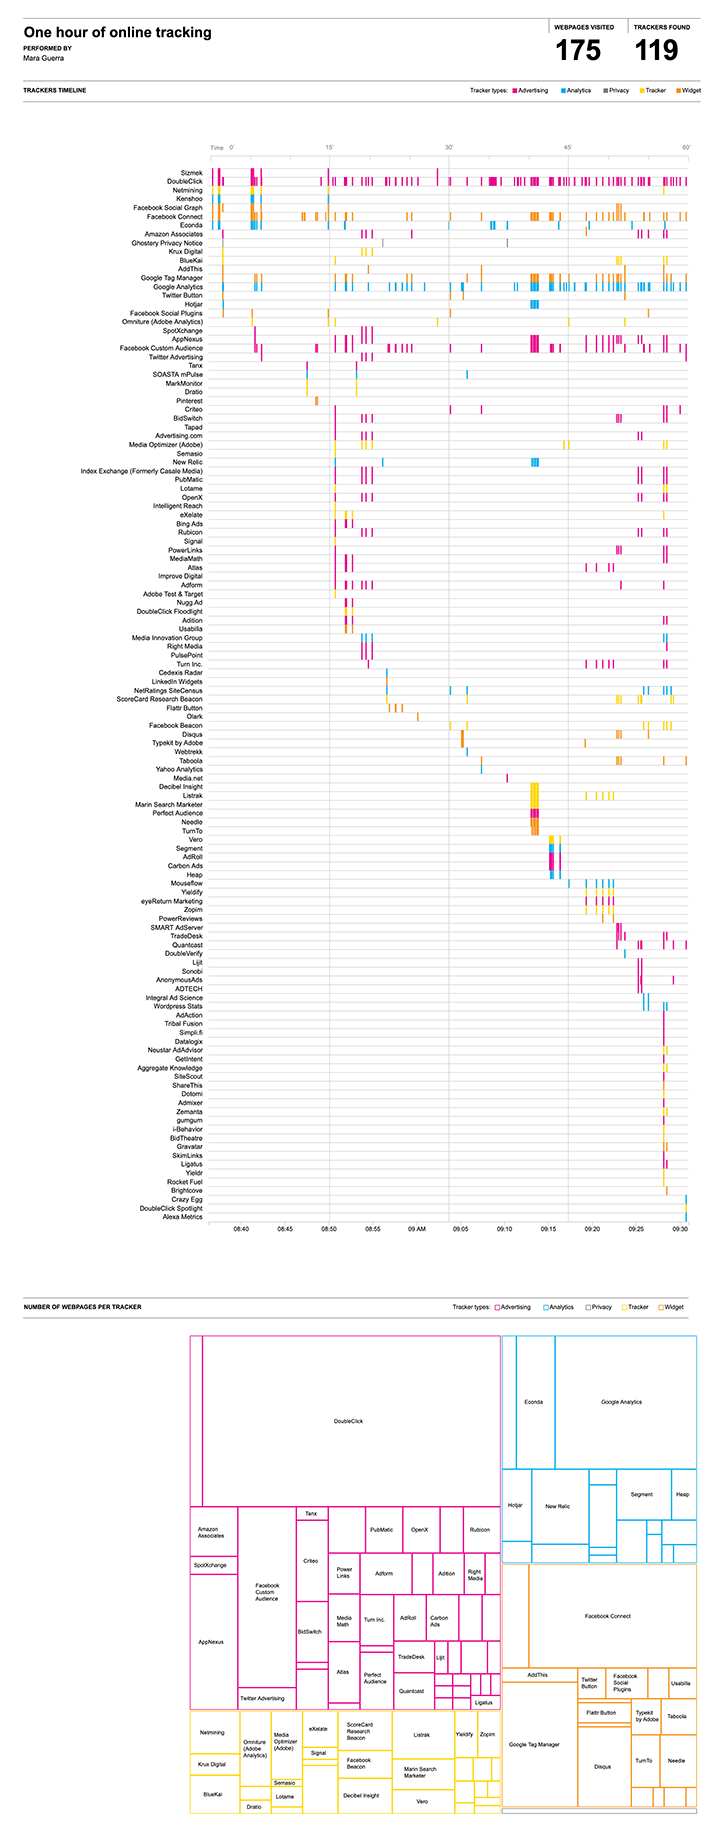
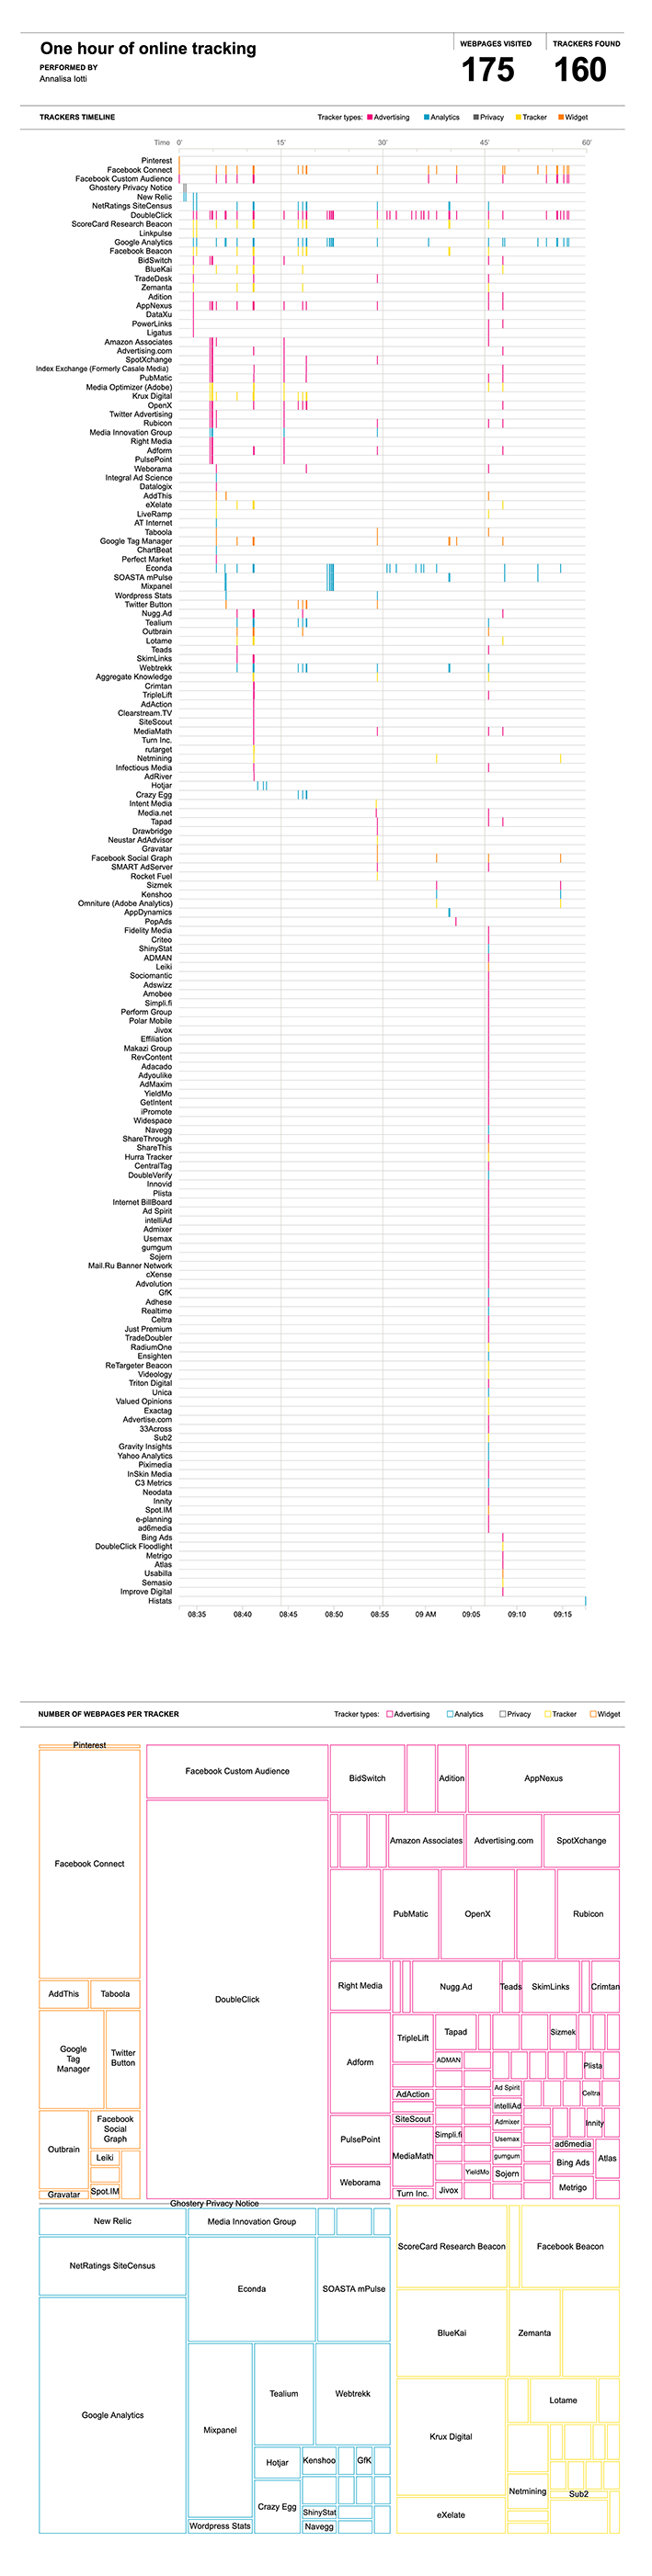
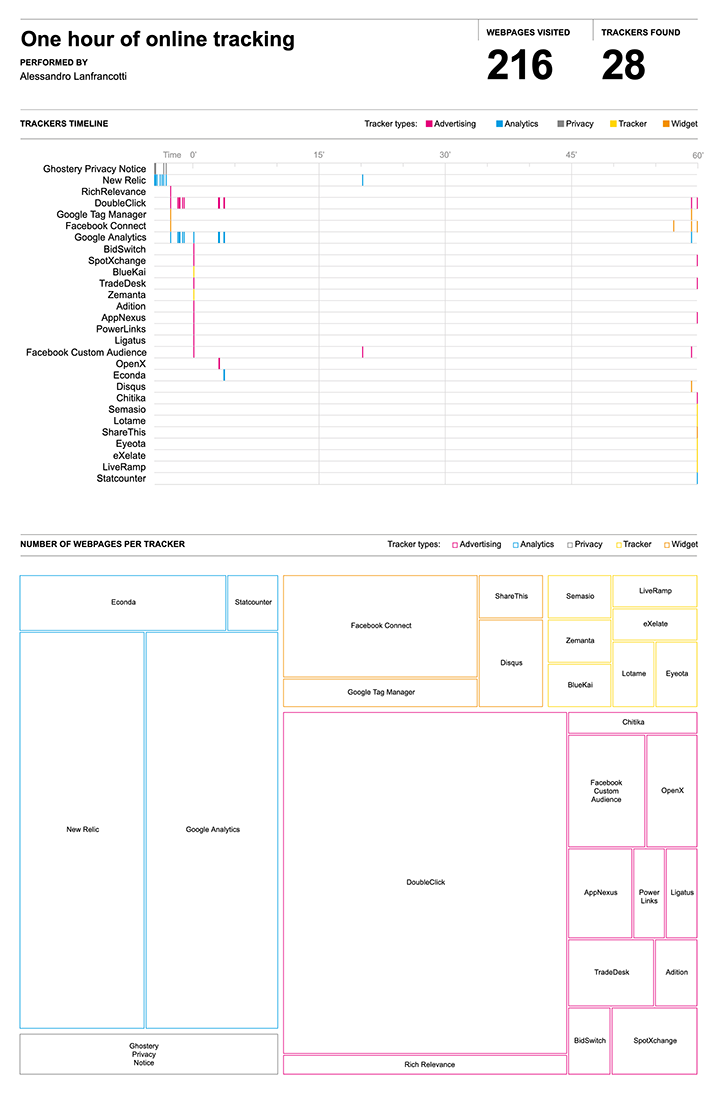
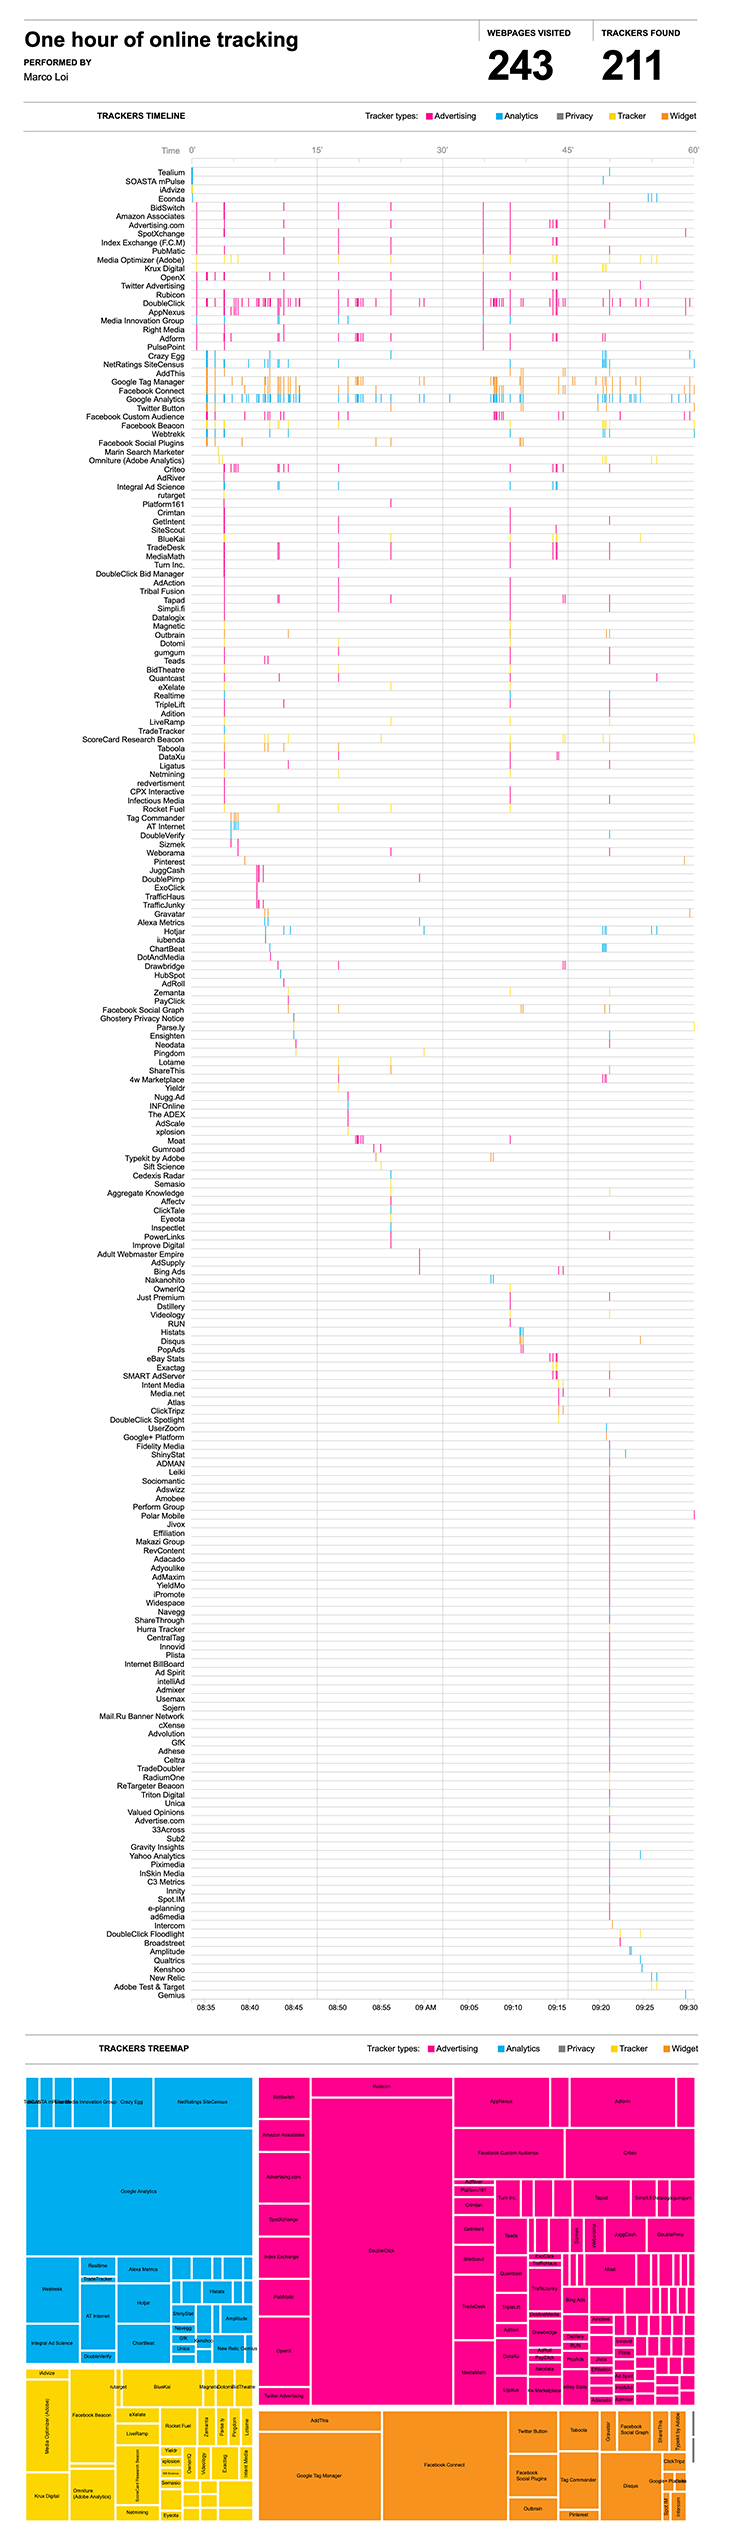
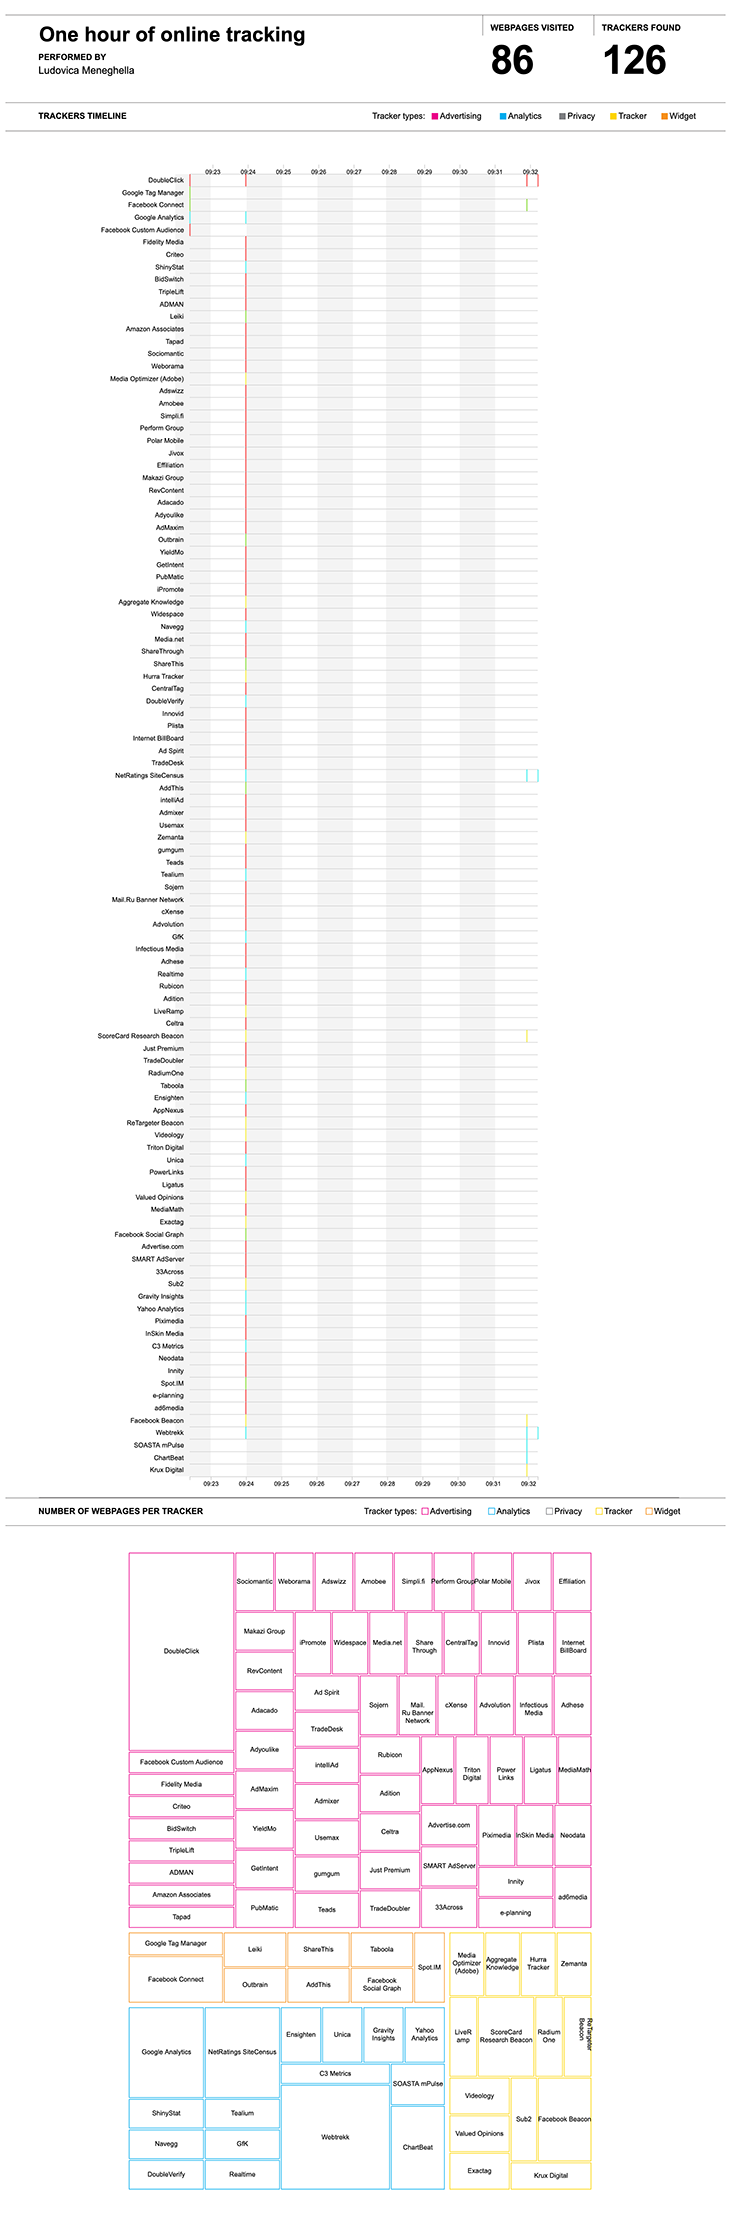
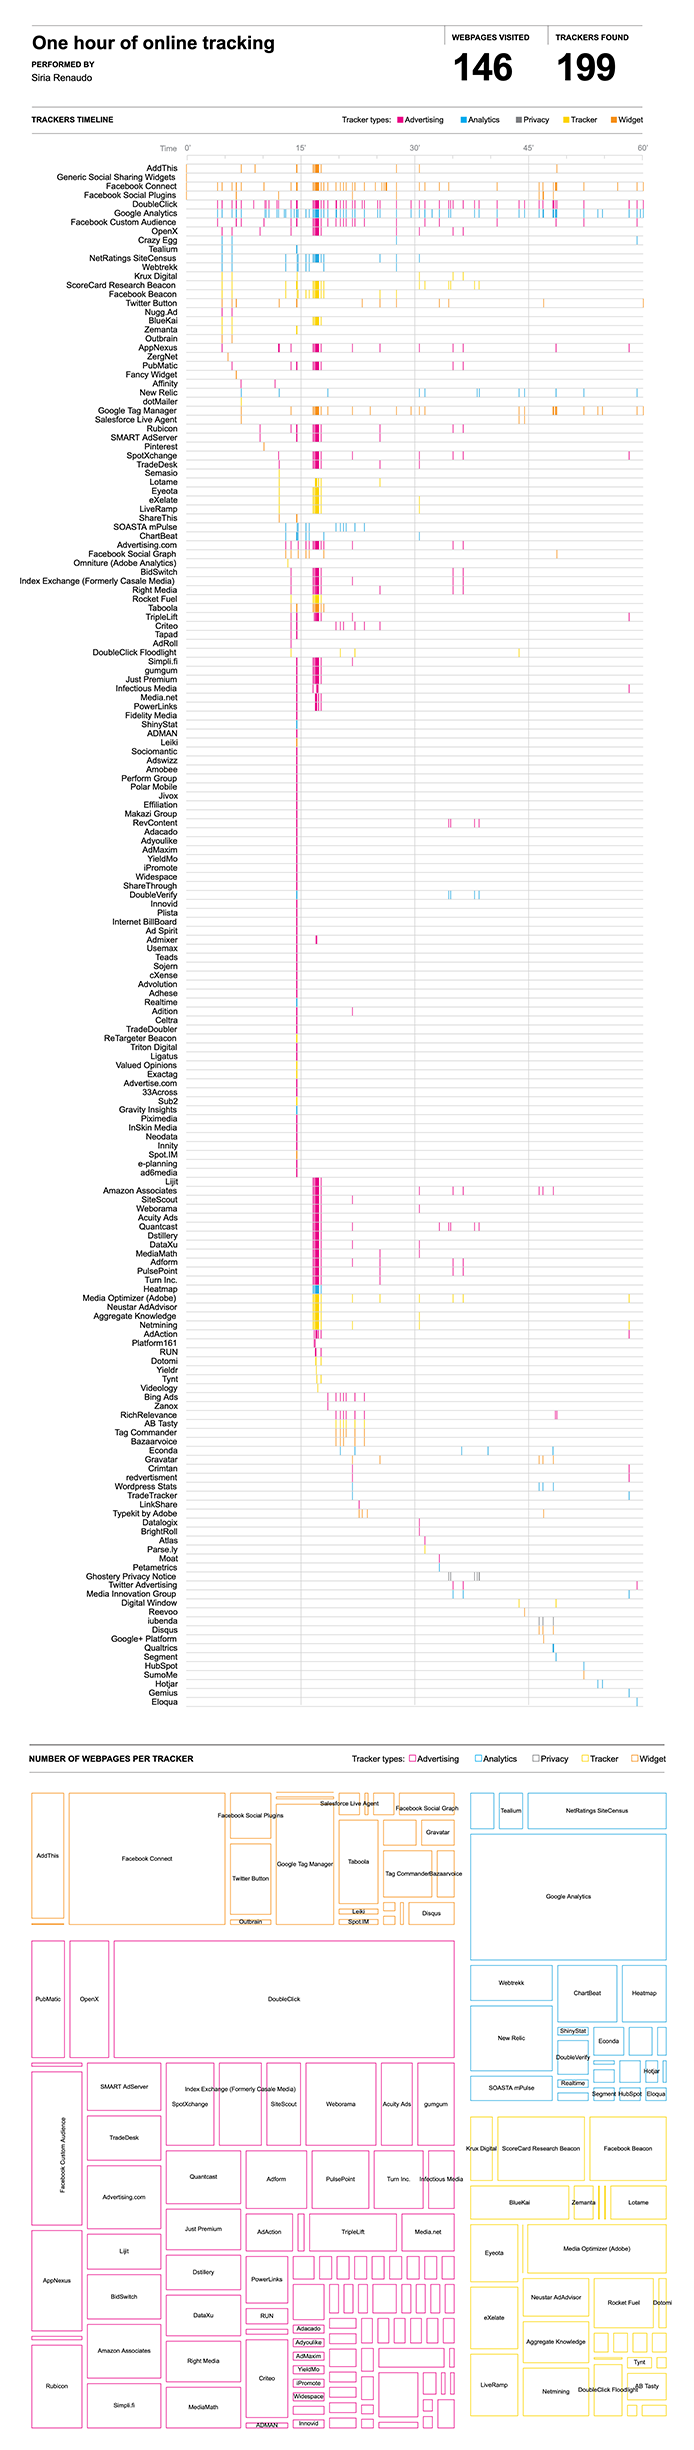
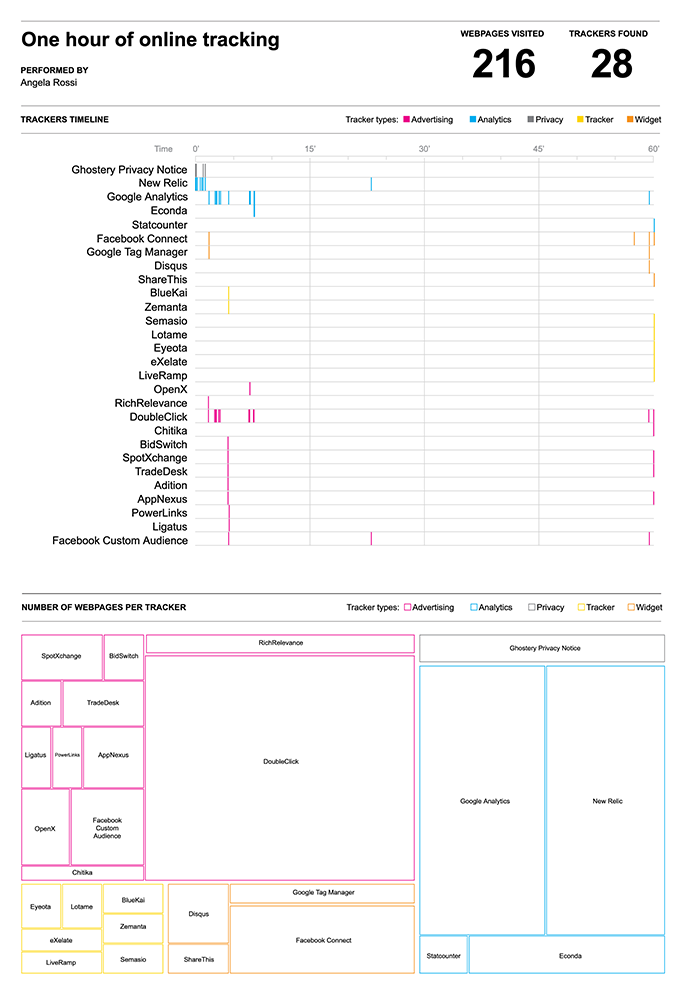
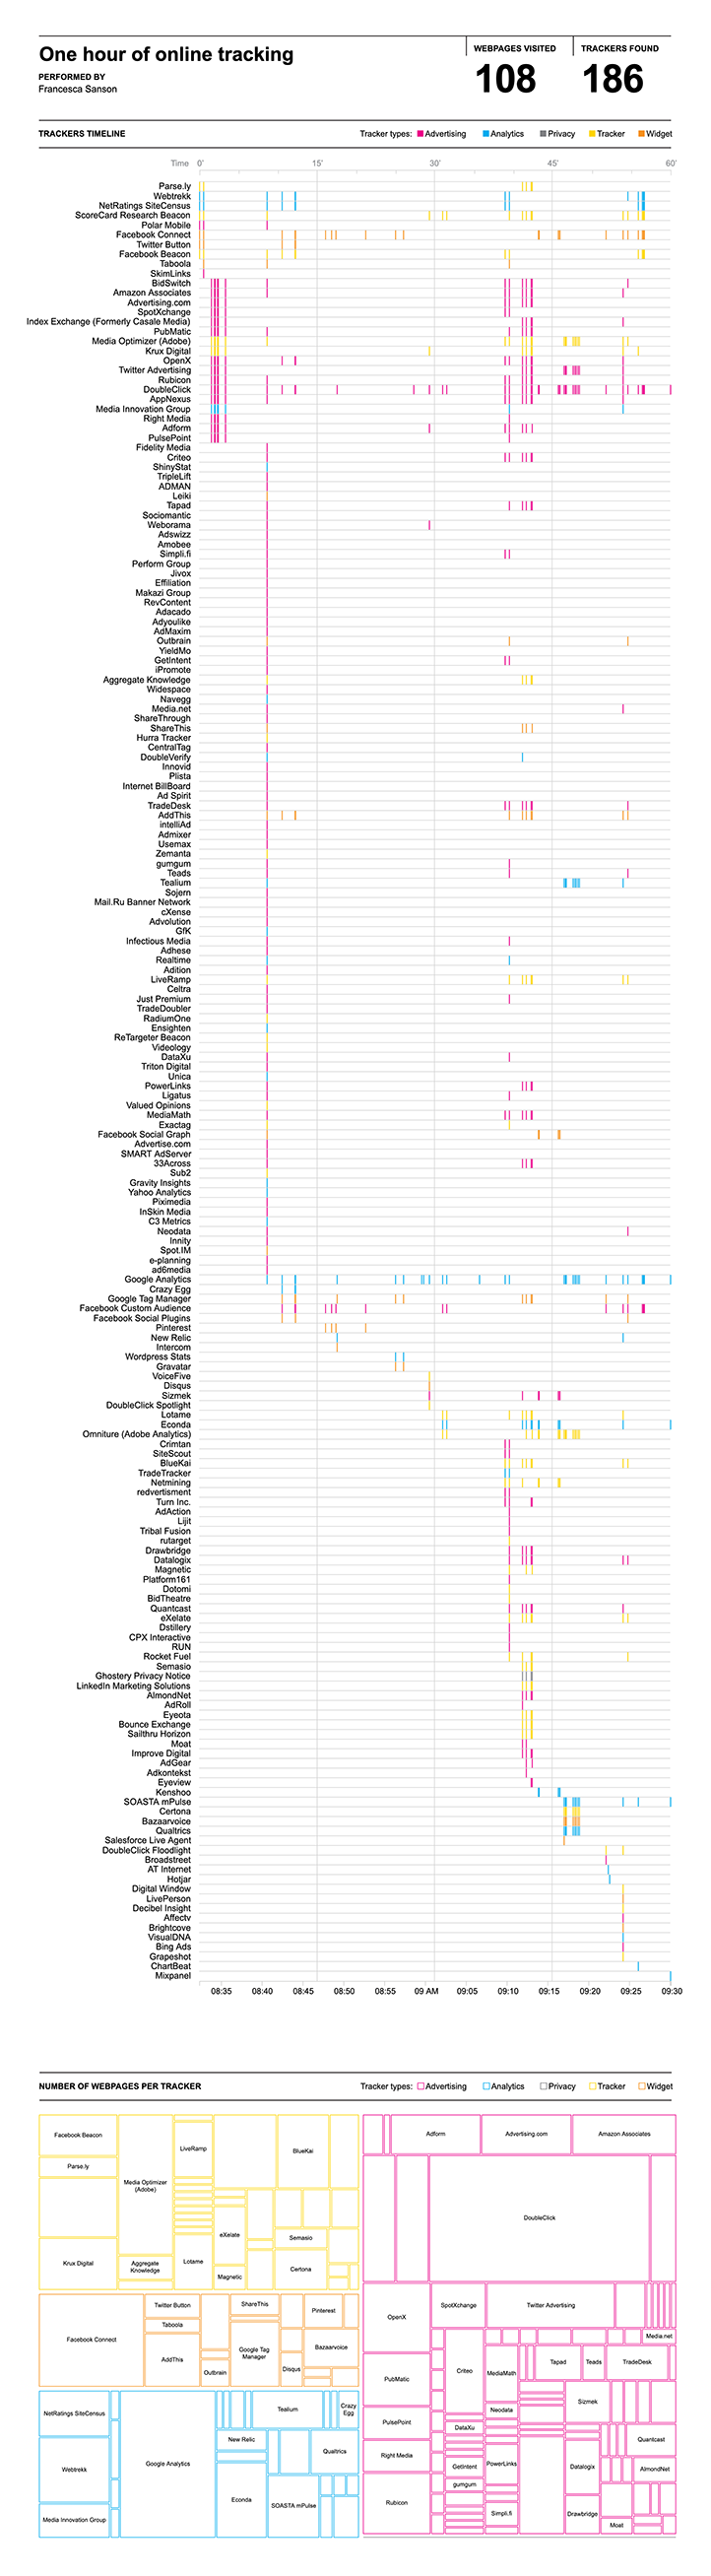
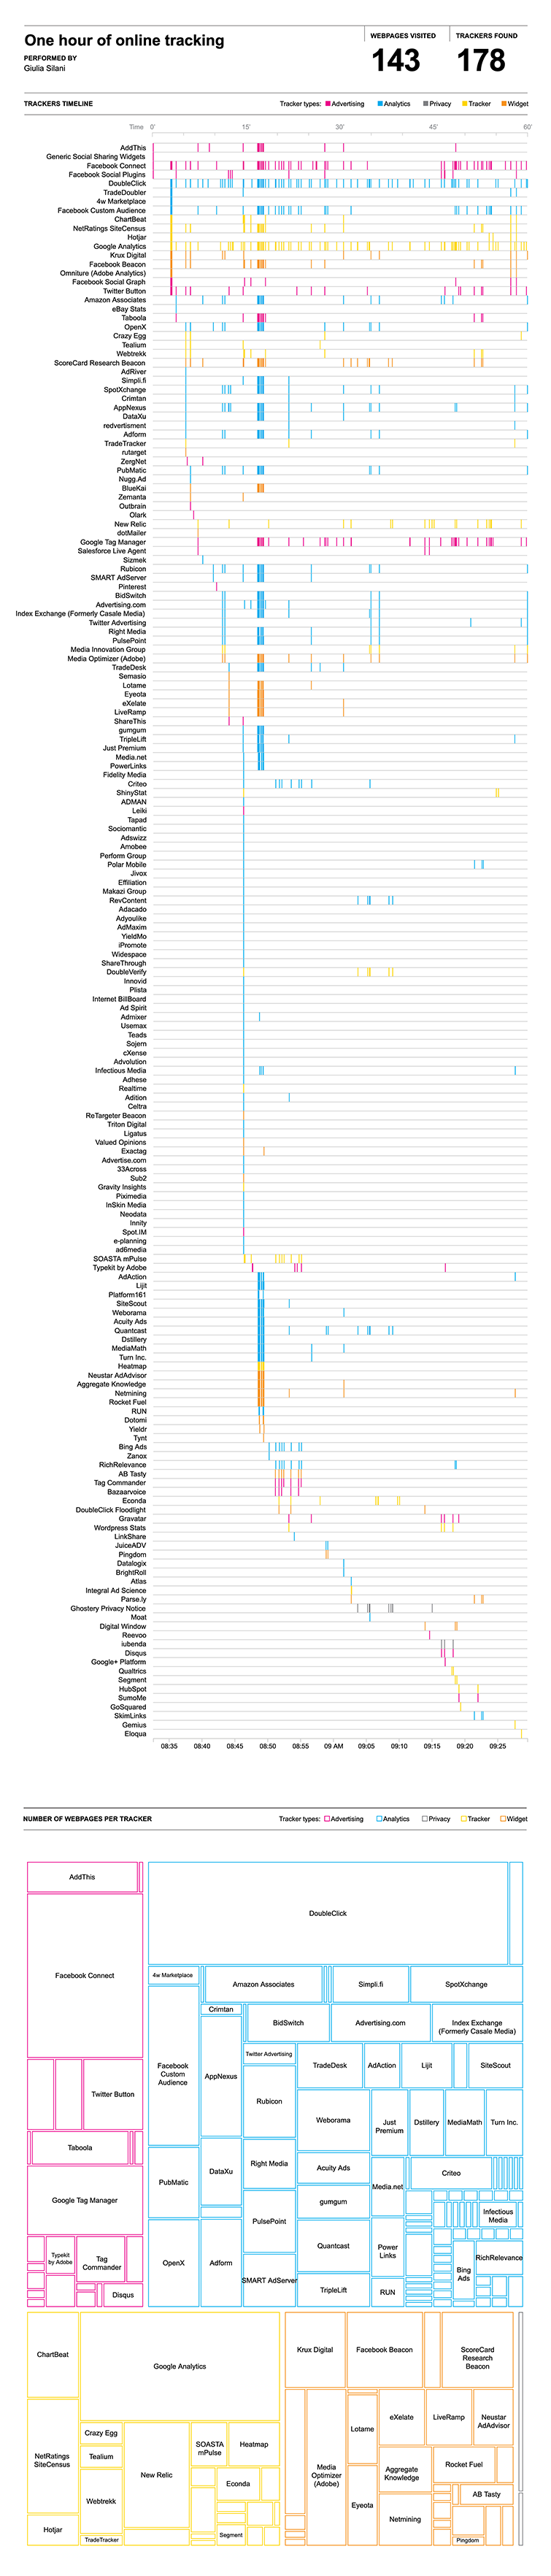
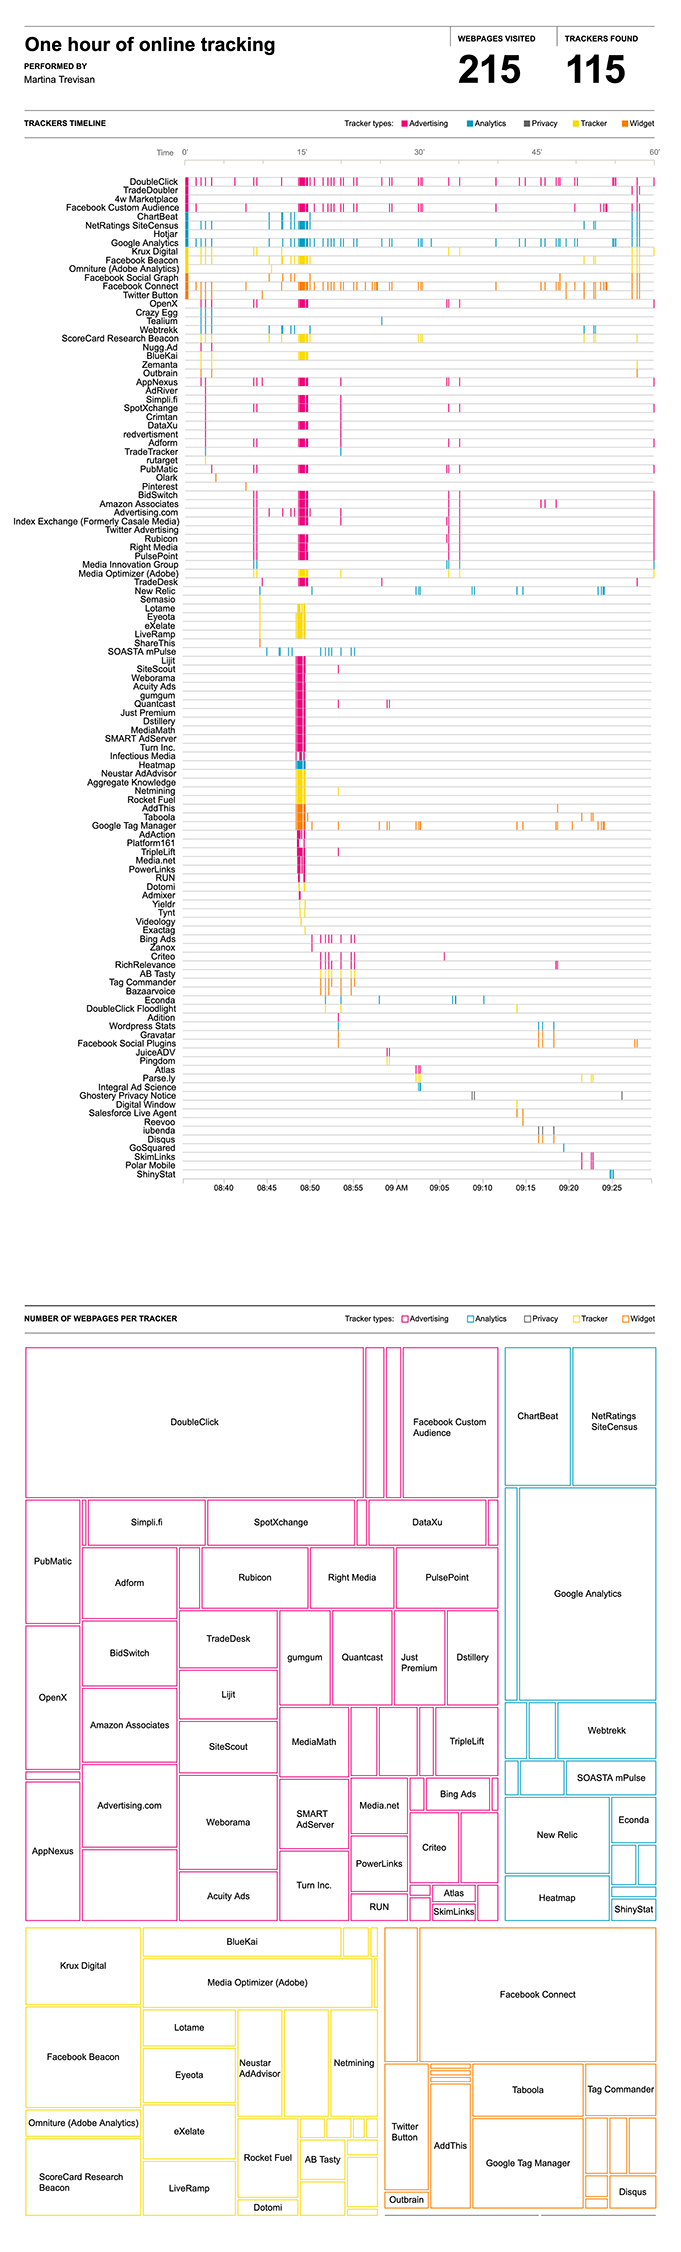
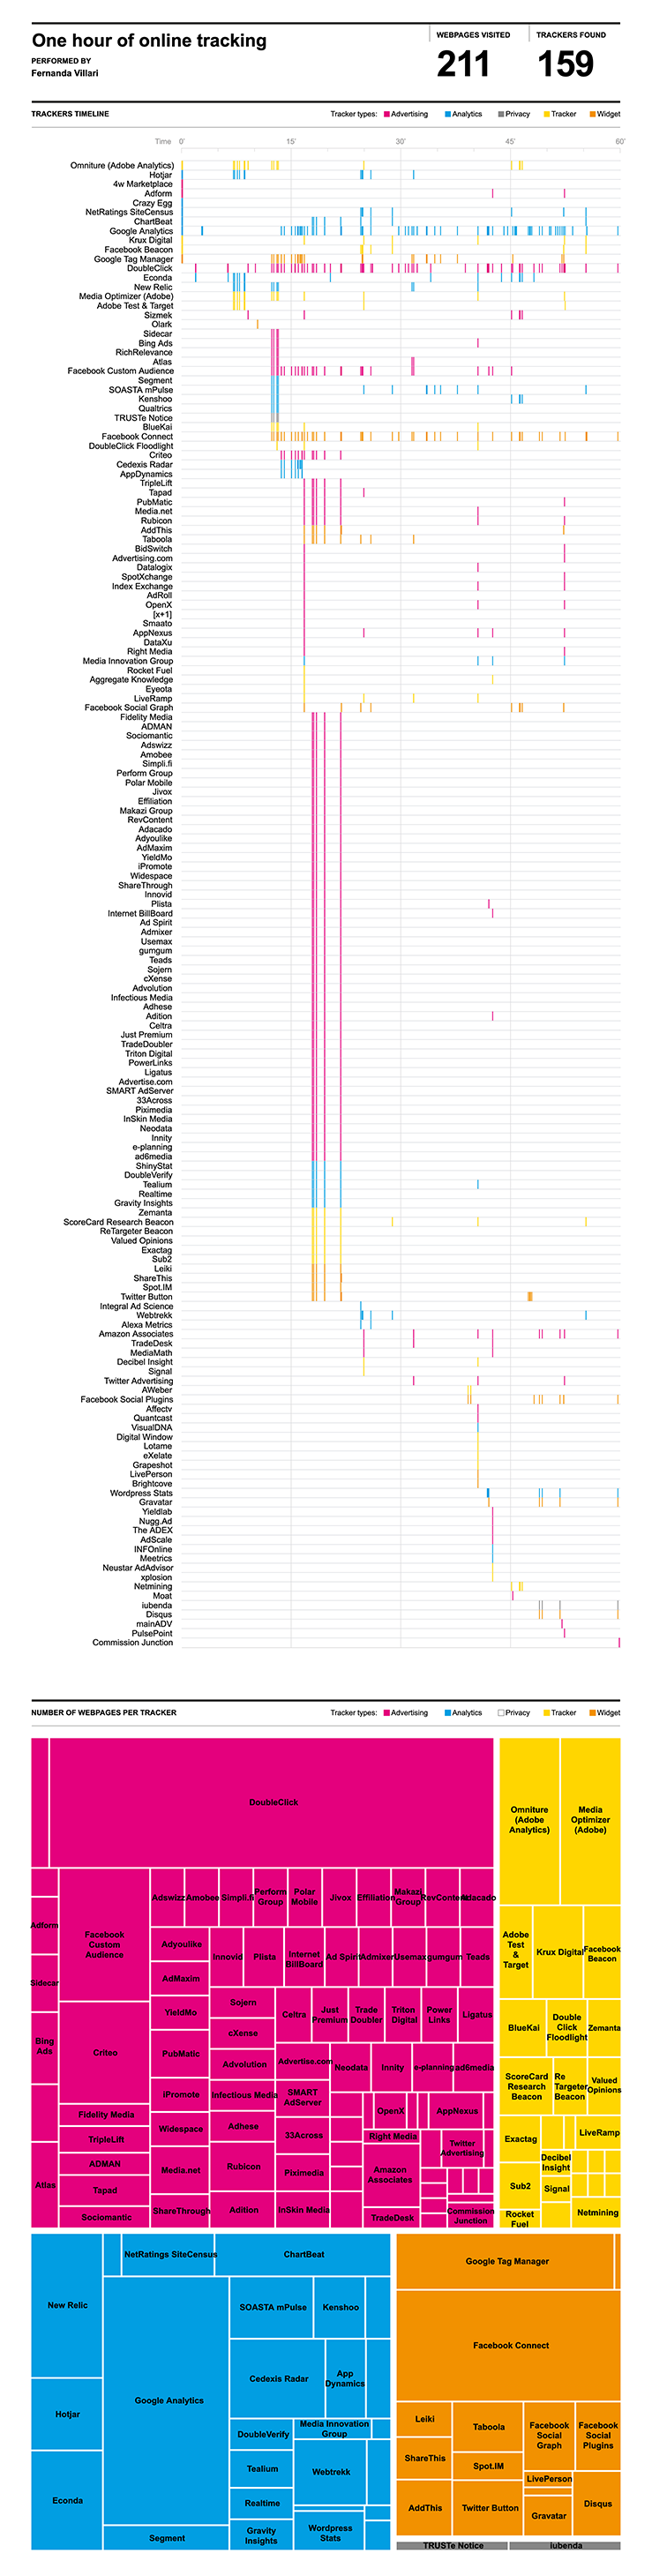
Web trackers are pieces of code that run in the background of a web pages to collect and share information about users activities. Online tracking is an integral component of the internet’s business model and it plays a vital role in a larger industry which profits out of our data [1]. During this chapter the students had to browse the web for one hour and extract and visualize the trackers that followed them. See an example of the output.
- Browse the web intensively for one hour
- Extract the browser history
- Input the seed list of URLs in the “Track Trackers” tool
- Export the results
- Visualize the timeline of the tracking activity and the categories of the third party trackers
- Create a web page with a responsive visualization
Tools: Mozilla Firefox, TrackTrackers, RawGraphs, Adobe Illustrator, Ai2Html, Github